
This Portland housing market update won’t be much of a surprise—the Portland market is hot, and several North Portland neighborhoods are some of the hottest. The first quarter of the year is generally a slow time for home sales. But things were a little bit different in Portland during the first quarter of this year. All signs indicate a very strong seller’s market, and it doesn’t look like the market will be cooling down anytime soon.
If you’ve either bought or sold a home in the last year, you know that the housing scene in Portland is changing fast. Three things show just how much buying and selling has changed since the first quarter of 2015: average days on the market, number of homes sold, and average sales price. We’ll take a look at each of these things, and we’ll take an especially close look at North Portland.
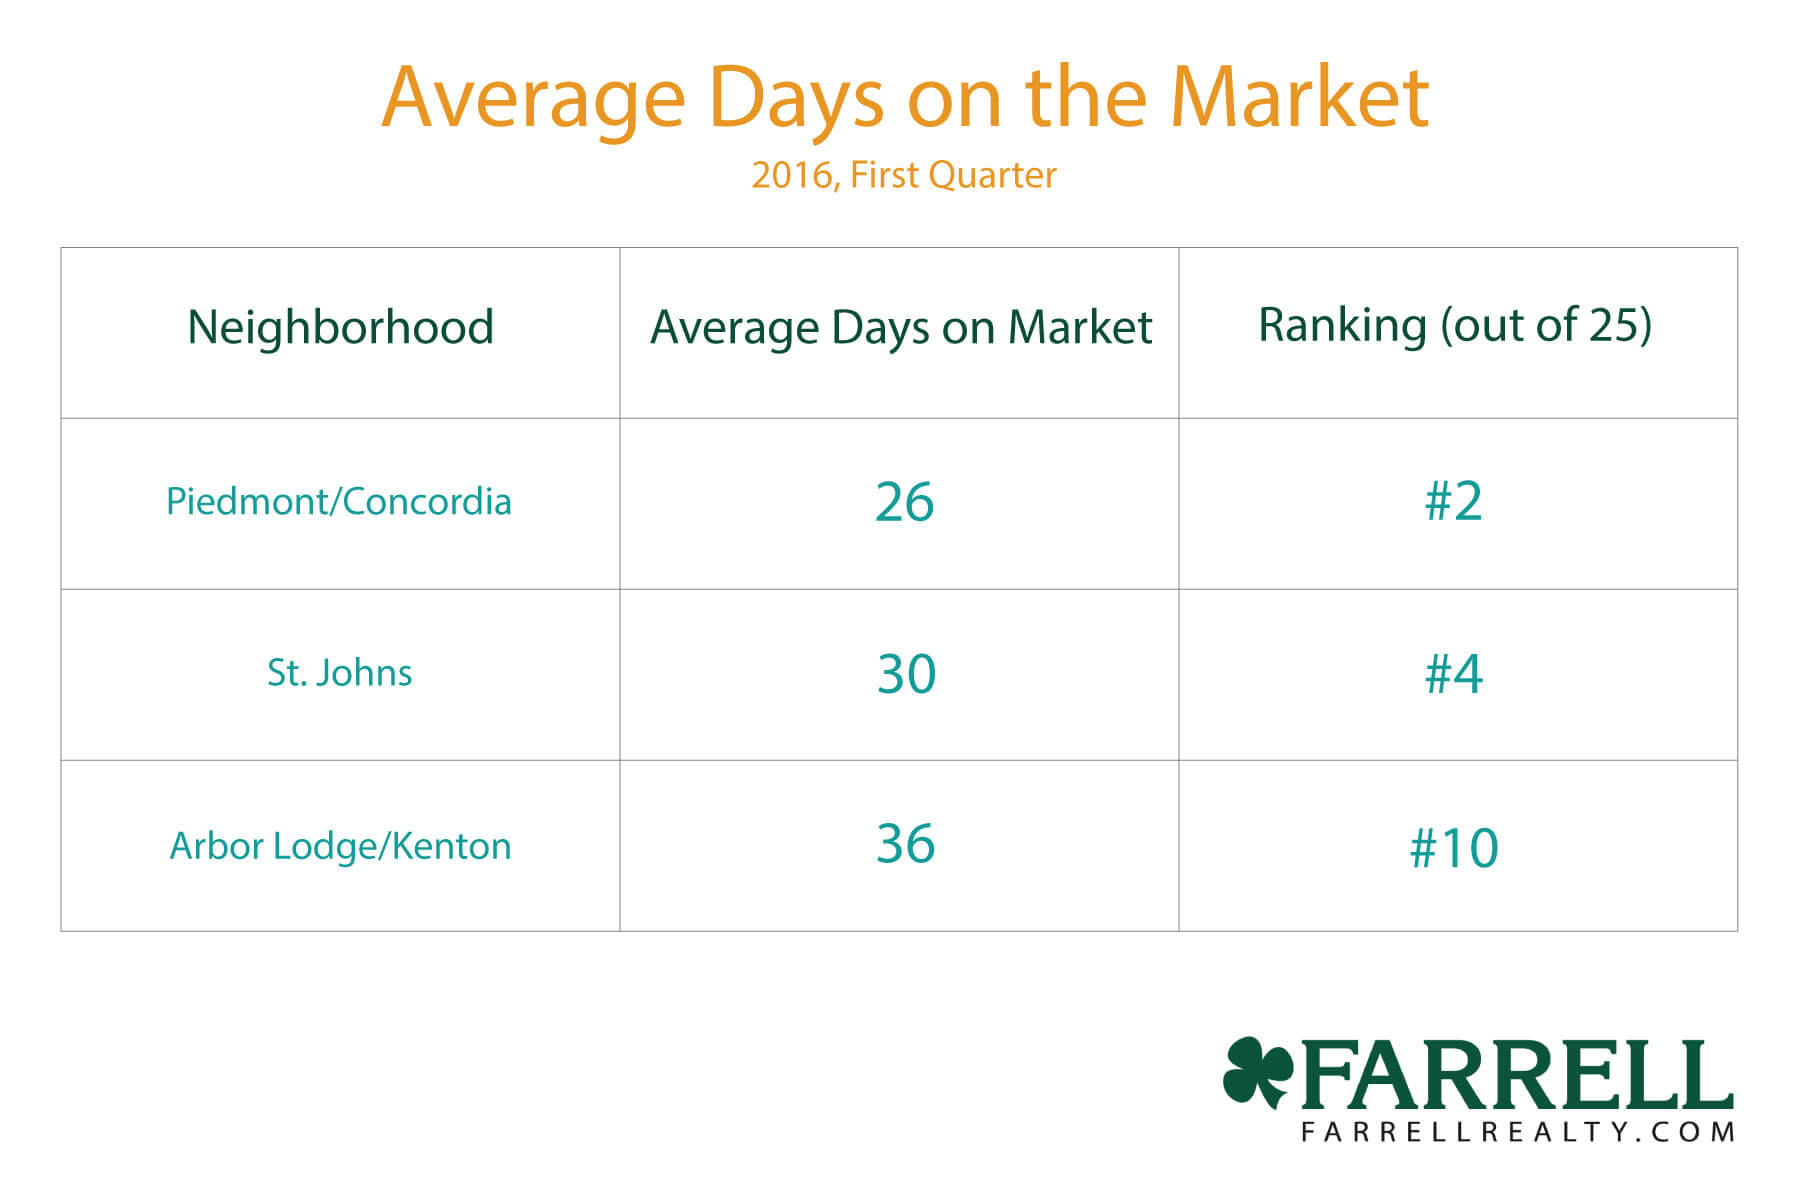
Days on the Market
On of the biggest indicators of a seller’s market—or a market where there’s more demand than supply—is how much time homes actually spend listed on the market. The more demand outstrips supply, the faster homes sell.
In the first quarter of 2015, there were no neighborhoods that averaged 31 days or fewer on the market. But this year, there were four neighborhoods on that list. Portland homes spent nearly 30% less time on the market during the first quarter of 2016 than they did during the exact same time period just last year.
As for Portland homes as a whole, the average time they spent on the market was just 55 days, which is way, way down from the average 78 days they were on the market during the same period last year.
Of the 25 neighborhoods that sell homes the fastest in the Portland area, 15 are in the city borders, and 10 are in nearby suburbs. These 25 ultra-hot zip codes account for over 40% of all home sales in the Portland area during the first quarter of this year. Here’s a look at North Portland, specifically.
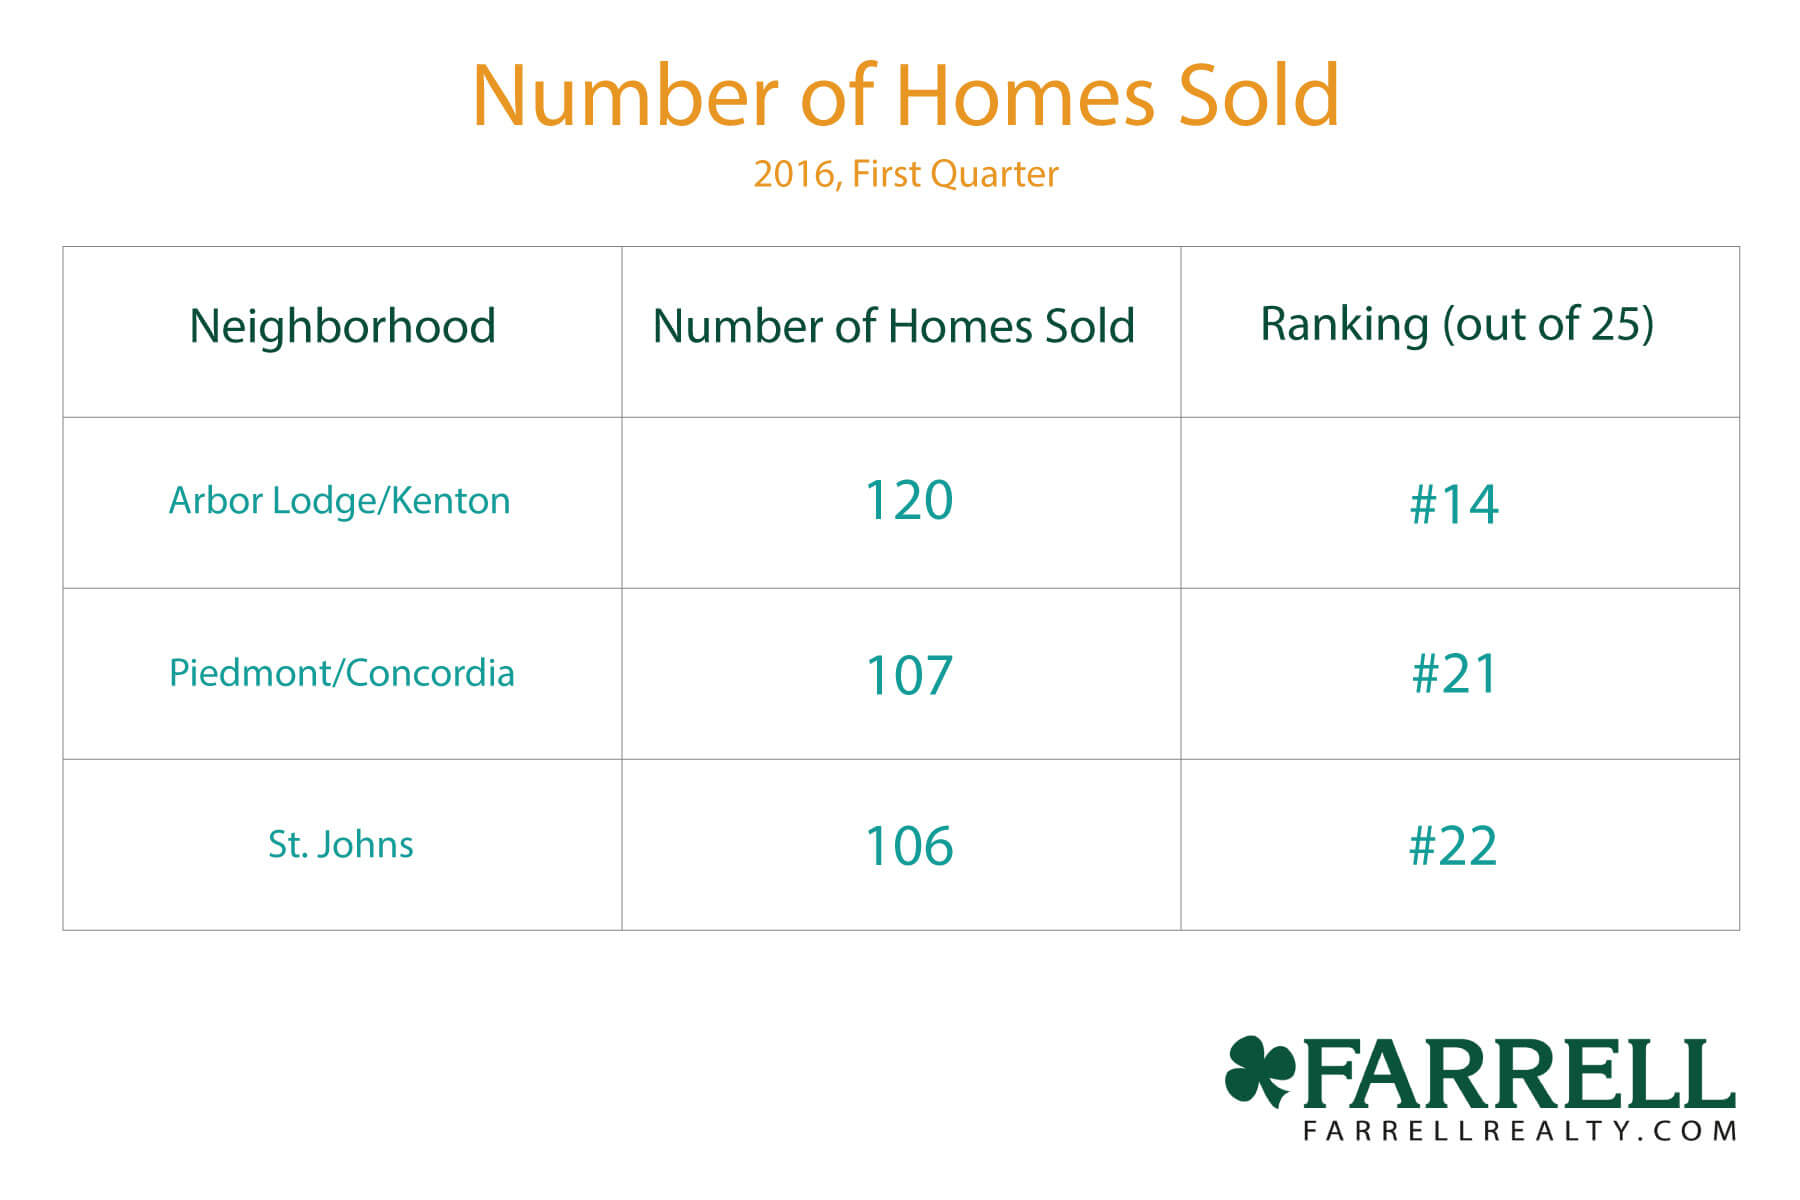
Number of Homes Sold
When people can’t find homes they can afford in the most popular (which usually means most expensive) neighborhoods, they start to turn to other neighborhoods to find something more affordable. So although the 25 top-selling neighborhoods accounted for around 55% of all metro-area sales both this year and last year, the distribution is different. This year, 10 of the top neighborhoods fall inside Portland’s city limits, while the rest come from surrounding areas and regional cities.
An important note: there were 6,136 home sales in Portland during the first quarter this year, which is up about 10% over the same period last year. Once again, here’s a look at North Portland’s hottest neighborhoods.
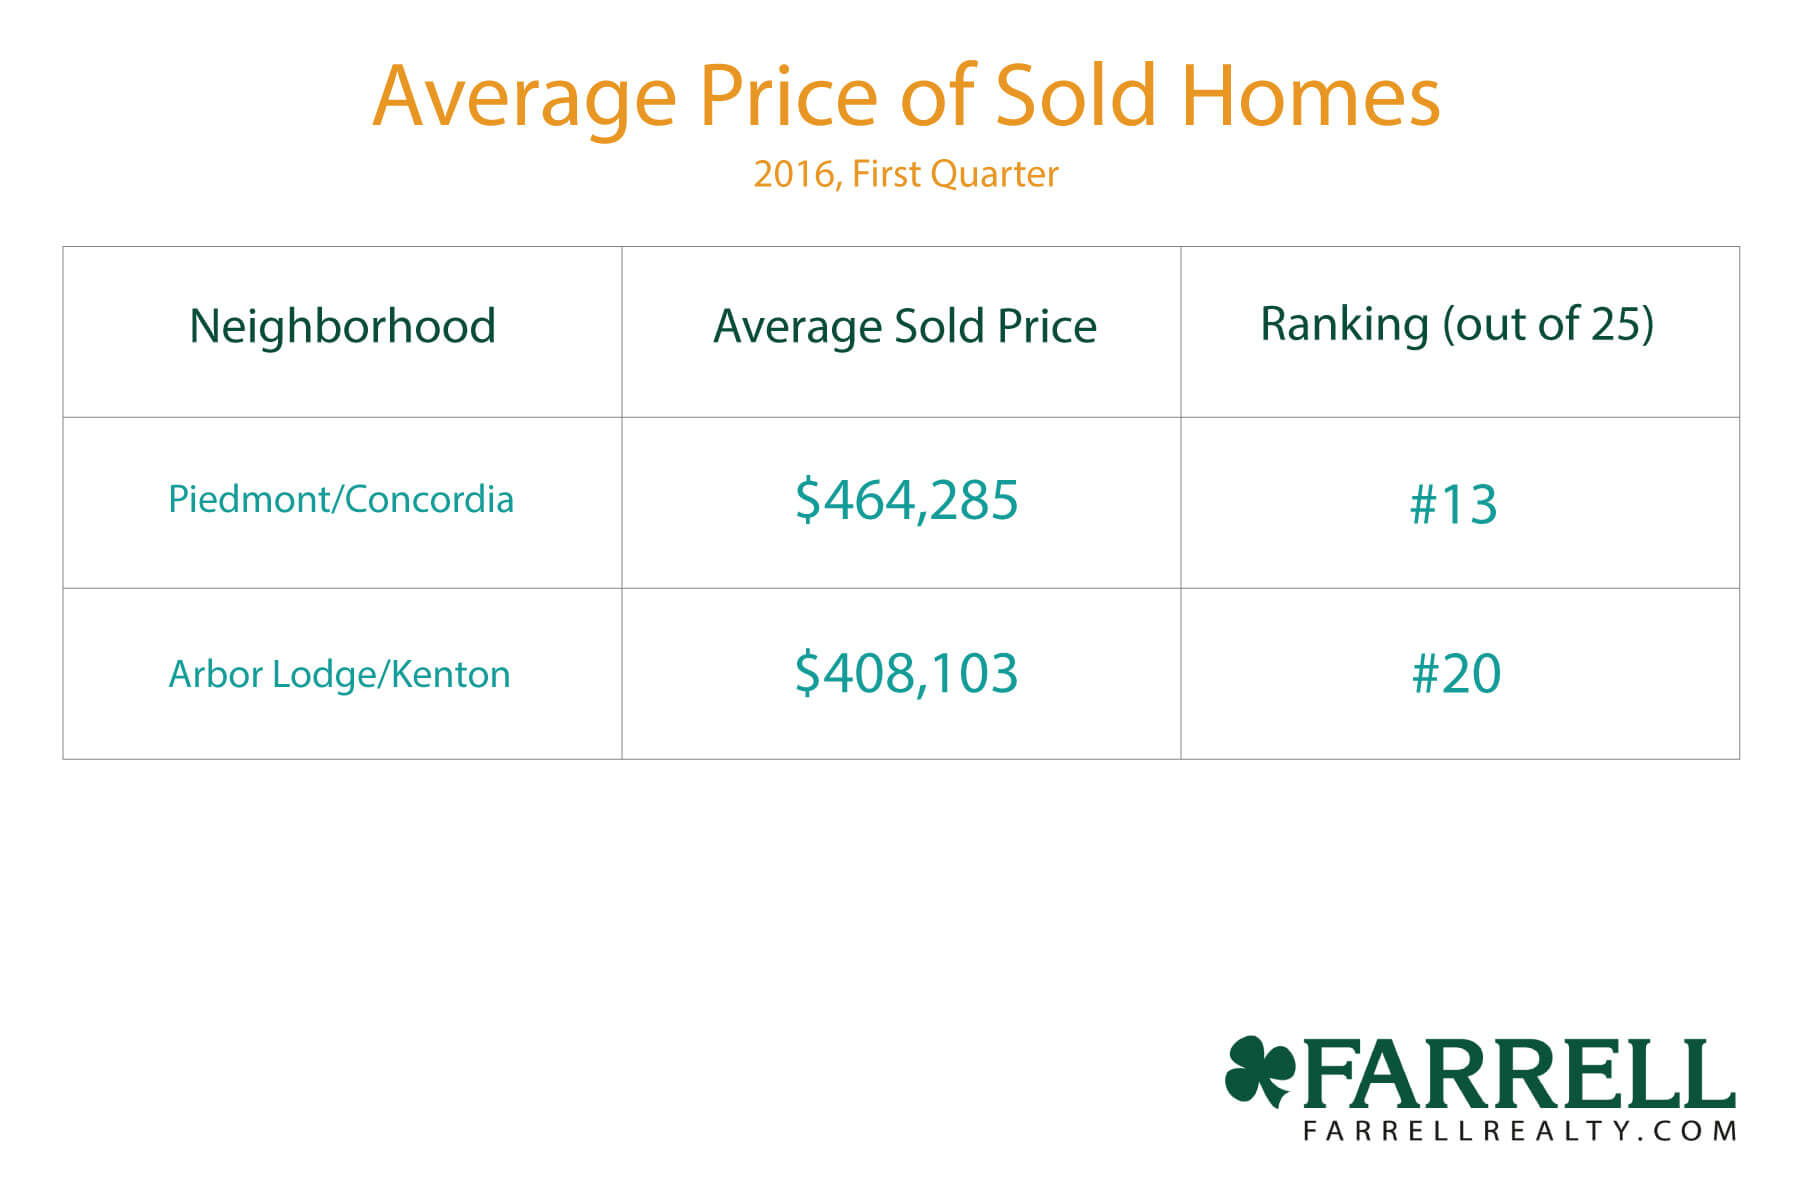
Price
Sales Price
In 2015, just five neighborhoods had an average sales price of $500,000. This year, we’re up to 11 neighborhoods in the Portland area with sales prices at least that high. Of the 25 most-expensive neighborhoods, 14 are within Portland city limits, and the rest are within the surrounding area.
The average regional sale price was $368,948, which is higher than the first quarter of last year by 11.1%. Here’s a look at North Portland’s neighborhoods, once again.
Price Changes
Check out this heat map, which covers the entire city. You can see that there have been dramatic price changes in parts of the city, even in the last year. The lists below the map also have a lot of cool demographic information, including population, median age, and median household income. You can also find lifestyle information, like info on parks and commutes.
Here’s a closer look at North Portland’s neighborhoods. The first number is the 1-year median price change, and the second number is the 5-year median price change.
- Arbor Lodge: 13.9%, 60.4%
- Piedmont: 14.7%, 74.1%
- Kenton: 13.7%, 53.6%
- Portsmouth: 10%, 53.6%
- University Park: 15.8%, 31.4%
- St Johns: 16.7%, 72.1%
- Overlook: 6.5%, 24.8%
- East Columbia: 42.1%, 58.8%
- Hayden Island: 39.%, 1.1%
- Bridgton: -1.2%, 119.3%
Portland Housing Market Update: 2016, Quarter 1 and The Future
A recent Zillow report about the top 10 housing markets in 2016 takes more into account than just hard real estate data. It considers income growth, unemployment rates, and home values. Even though unemployment in Portland is on the high side, wage growth is solid, and clearly, home values are climbing fast. These factors all contribute to a very hot market.
If there’s any way we can help you, give us a call at (503) 283-1900! Whether it’s buying or selling your North Portland home, nobody knows North Portland like we do—even when the market’s changing fast.